Skip to:

Big data analytics made for business users

Any business can aggregate large volume of information, and any users can start exploring and segmenting in no time at all.

Get to know your clients

Drive Big Data exploration with an easy to use analytic interface

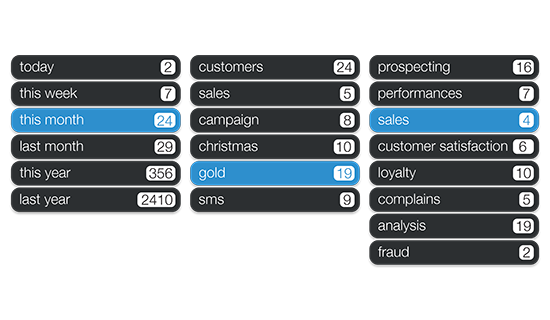
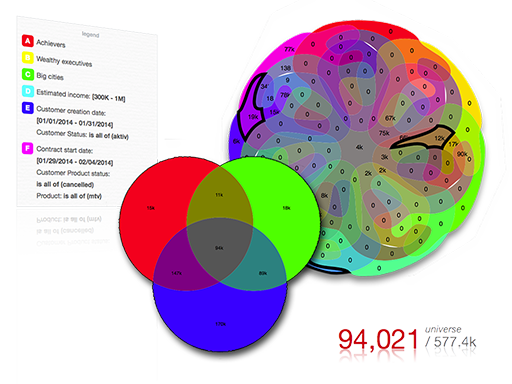
Anyone can start rapid exploration of big data repositories. With an intuitive use interface, you can create segments based on simple criteria, or business-driven filters. Exploration is as simple as looking for a holiday trip on hotel.com! Ajust slider controls, pick values, enter your criteria, and you see your target group segmented live in a graphical way, including in an incredible venn diagram.

Open the doors to A/B Testing. Use categorised filters to create additional effects, such as global filters, quarantine filters.

Data is beautiful

Live dashboards, advanced graphics, seeing is believing

Create customs dashboard from a large choice of graphics, including bar charts, pie charts, radar or cloud tags and even see on an interactive map where people are located!

Add an overlay to a map such weather forecast, traffic information to predict trends!

Continue your exploration, and modify your criteria, your dashboards are updated live and reflect the new selection!

Organize your segments

All your activities, simple to find and work with

No need for complex classification or structure. It's never been easier to organise all your work.

The user interface has been tailored to support facetted searches. Filtering on authors, tags, dates is always just one click away! Or you can do free text search too!

Start fast

Start from templates, be activities driven, work efficiently

You will never start from a blank page. Every new segment starts from a template that is activity driven. It always come with good default settings and criteria sets. It's a fast way to get into work such as prospecting, analysing trends, increase sales, campaigns... It's all configurable and tailored to be used for your needs.

Collaborate and share

Engage with social collaboration and knowledge sharing

Share your work, get feedbacks from your colleagues.

At any time, you can share your work by email, people can comment with messages, and even rate the progress!

You can even export to Excel the list of people to treat the results your own way if you want to!

Fast results

Instantaneous answers, no matter data volume

All searches are executed against NoSql datastores. That delivers instantaneous results, no matter the volume of data.

That way, you can get in exploration mode and realise live the effects of your searches.

Compatible with your business

Easily export your segments to your favorite tool

Integration with CRM system, campaign managers, mass mailings and SMS is as easy as connecting your business tools to our REST API, or simply export to CSV.

Any data, any volume, any velocity

No need for predefined data structure

There is no need for a large data warehouse projects that spread across months. There is no need to know your data in advance. Prism analytics can crunch any unstructured dataset for any type of industries. Only simple configuration is needed to get started.

And since it's cloud based, you can get started now, no need for software installation.

Response analysis

Interpret how your segments react

When you create segments, a unique tracker identifier is created from which you can use the links of your mass mailing, newsletters, coupons and other. Prism Analytics will intercept the responses and provide you with deep analysis of how your target groups has responded.

Create activity driven dashboards based on demographics, behaviour, temporal... and even live events!

And as a loop-back process, all the collected responses are also available for further segmentations!